Debugging javascript app in browser
- Identifying the bug is the first step in the process of debugging.
- Almost all browsers provides developer tools which help the developers to find the bugs.
- All browsers has similar terminology in developer tools.
- This article is uses google chrome to debug the app.
Using console.log()
- Basic type of debugging is to add the console.log() statements in the code to see whether the code is reacing the added log statement or not.
- It also helps to check the data available in the variables.
- Drawback: This method consumes more amount of time but it works.
Browser Dev tools
Right-click on any element of a webpage and select "Inspect" or simply press Ctrl + Shift + I (or Cmd + Option + I on macOS). This opens the Developer Tools panel.
-
Elements: The "Elements" tab shows the HTML and CSS of your page. You can modify the content and styles in real-time to see how changes affect your page.
-
Console: The "Console" tab is where you can view and interact with the JavaScript console. This is useful for logging messages, evaluating code snippets, and identifying errors.
-
Sources: The "Sources" tab allows you to view and edit the source code of your web application. You can set breakpoints, step through code, and examine variables to understand how your code is behaving.
-
Network: The "Network" tab lets you monitor network activity, including requests and responses. This is useful for diagnosing performance issues and inspecting API calls.
-
Performance: The "Performance" tab helps you analyze your webpage's performance by recording and analyzing various events, such as loading, scripting, rendering, and painting.
-
Memory: The "Memory" tab assists in identifying memory leaks and optimizing memory usage of your web application.
-
Application: The "Application" tab is used for inspecting and manipulating web storage, cookies, and service workers. It's helpful for debugging issues related to caching and data storage.
-
Security: The "Security" tab identifies potential security issues on your website, such as mixed content warnings and insecure origins.
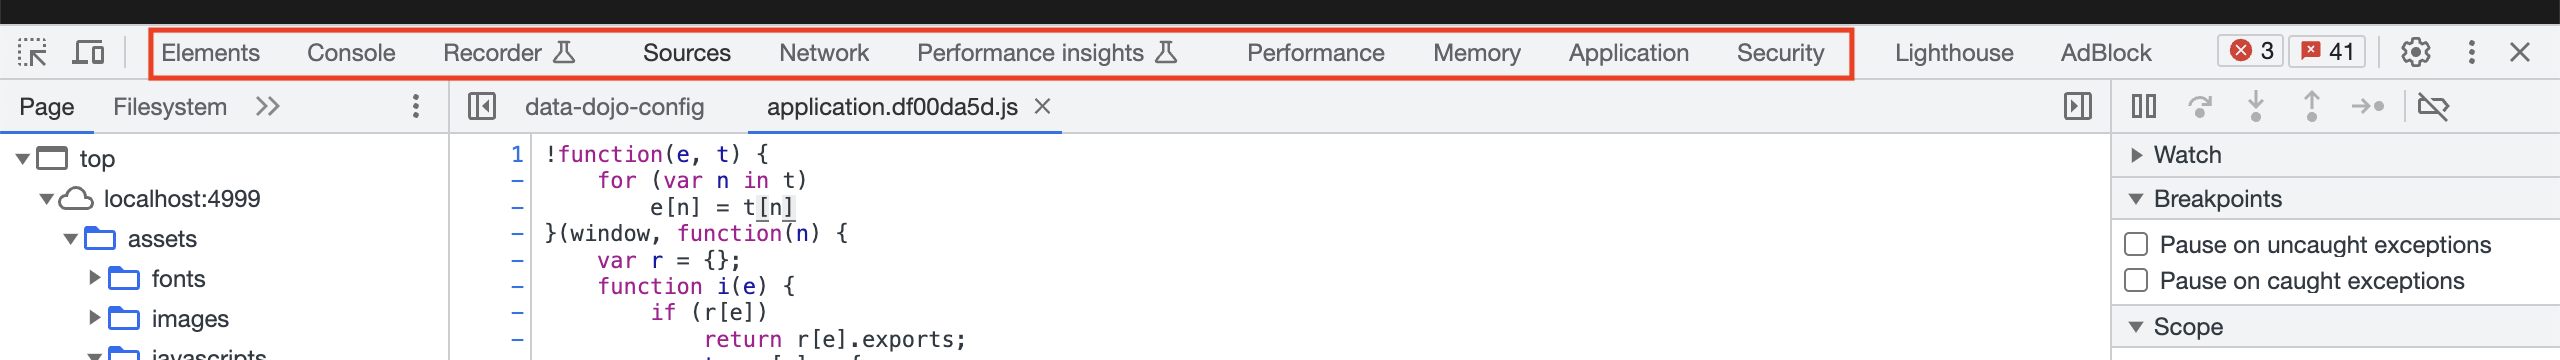
- Out of these dev tools we mostly use "sources", "console" and "network" tools very frequently.
sources panel
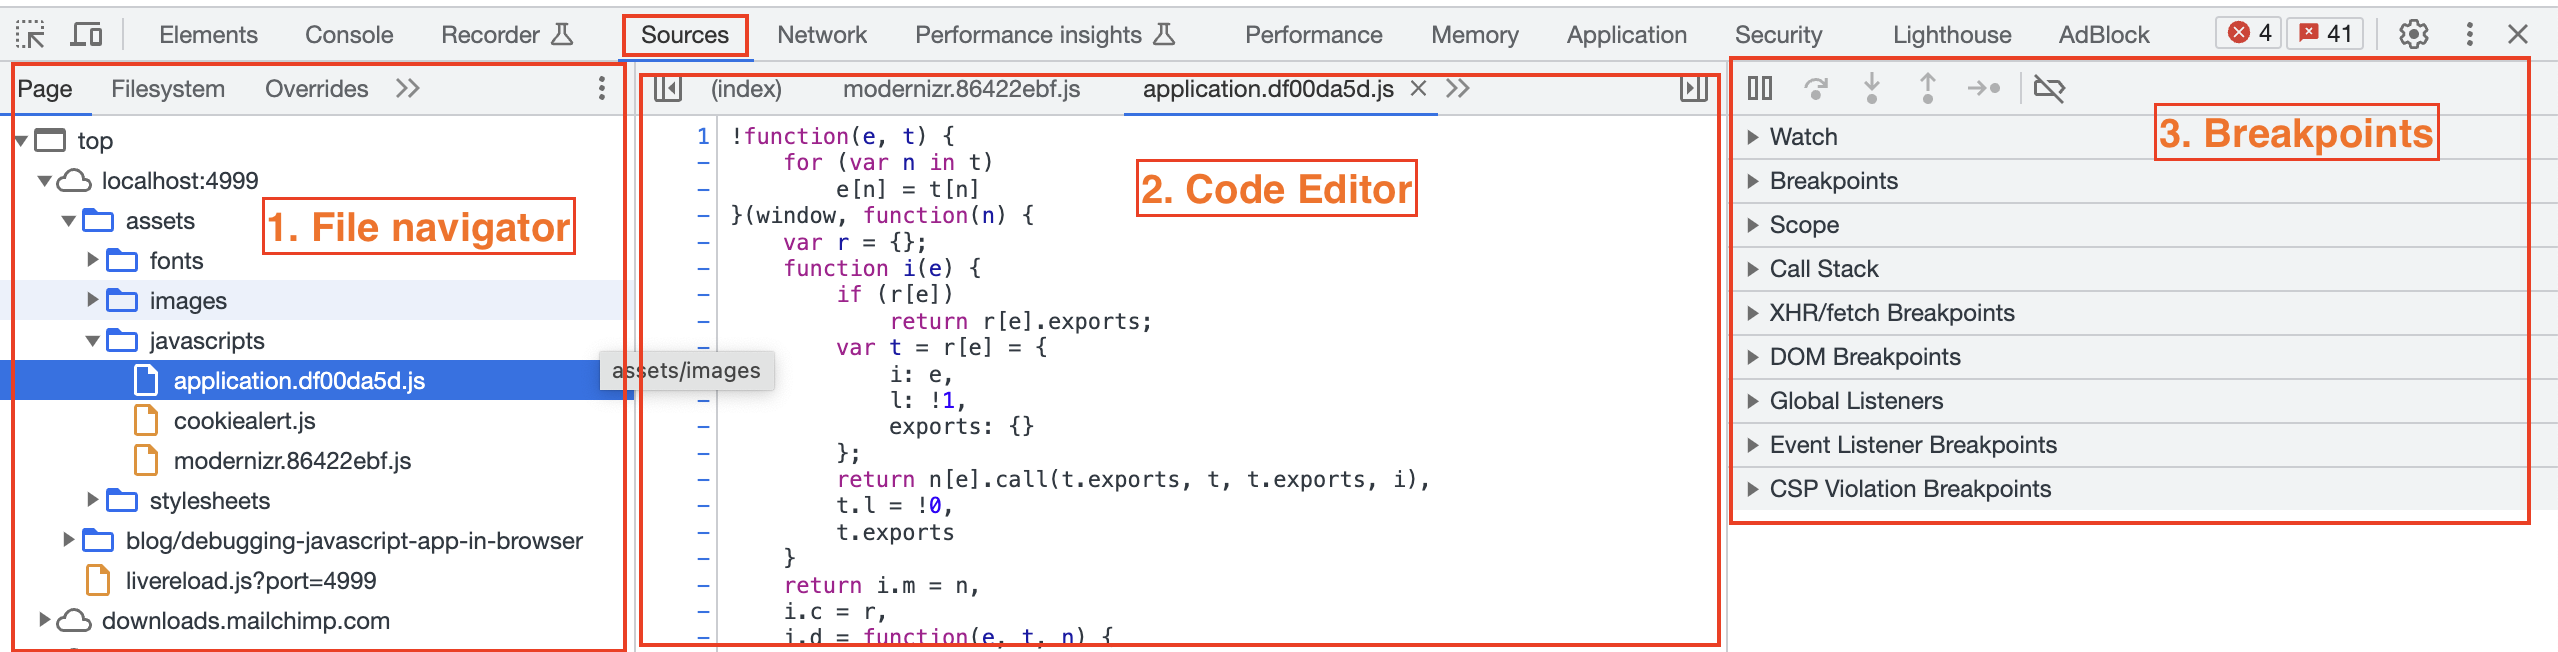
File navigator
- The "Sources" panel provides a file explorer on the left side
- It allows us to navigate through the various files that make up the web page, including HTML, CSS, and JavaScript files.
Code Editor
- We can open and edit JavaScript, HTML, and CSS files directly within the DevTools.
Debugging
Breakpoints
- A breakpoint is a point of code where the debugger will automatically pause the JavaScript execution.
Add breakpoints
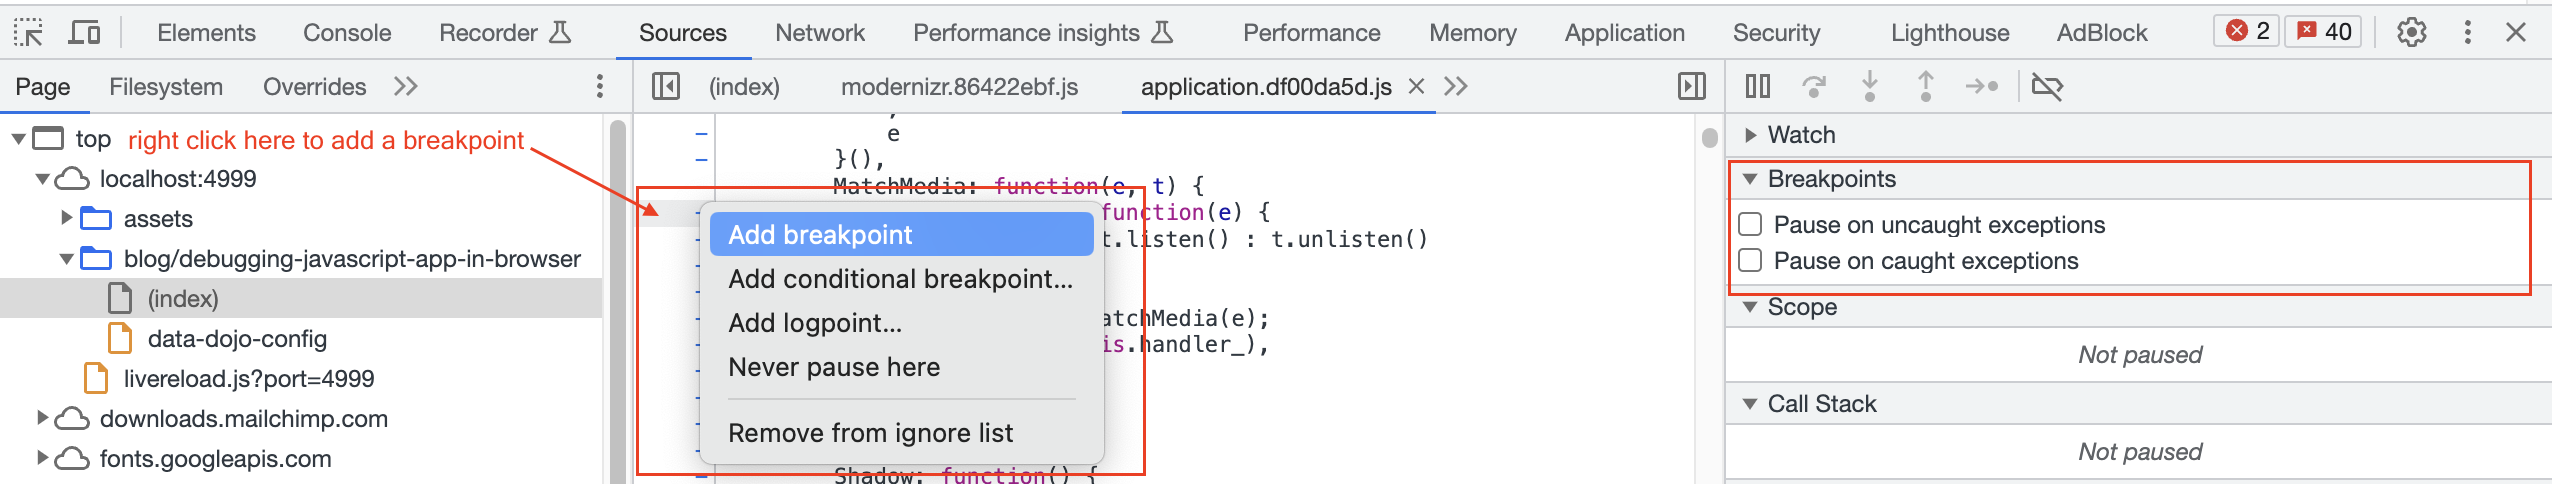
- We can add the breakpoint from source panel by opening a file and right click on the specific line or the code.
- Then it will show the breakpoint options i.e breakpoint, conditional breakpoint, logpoint, etc.
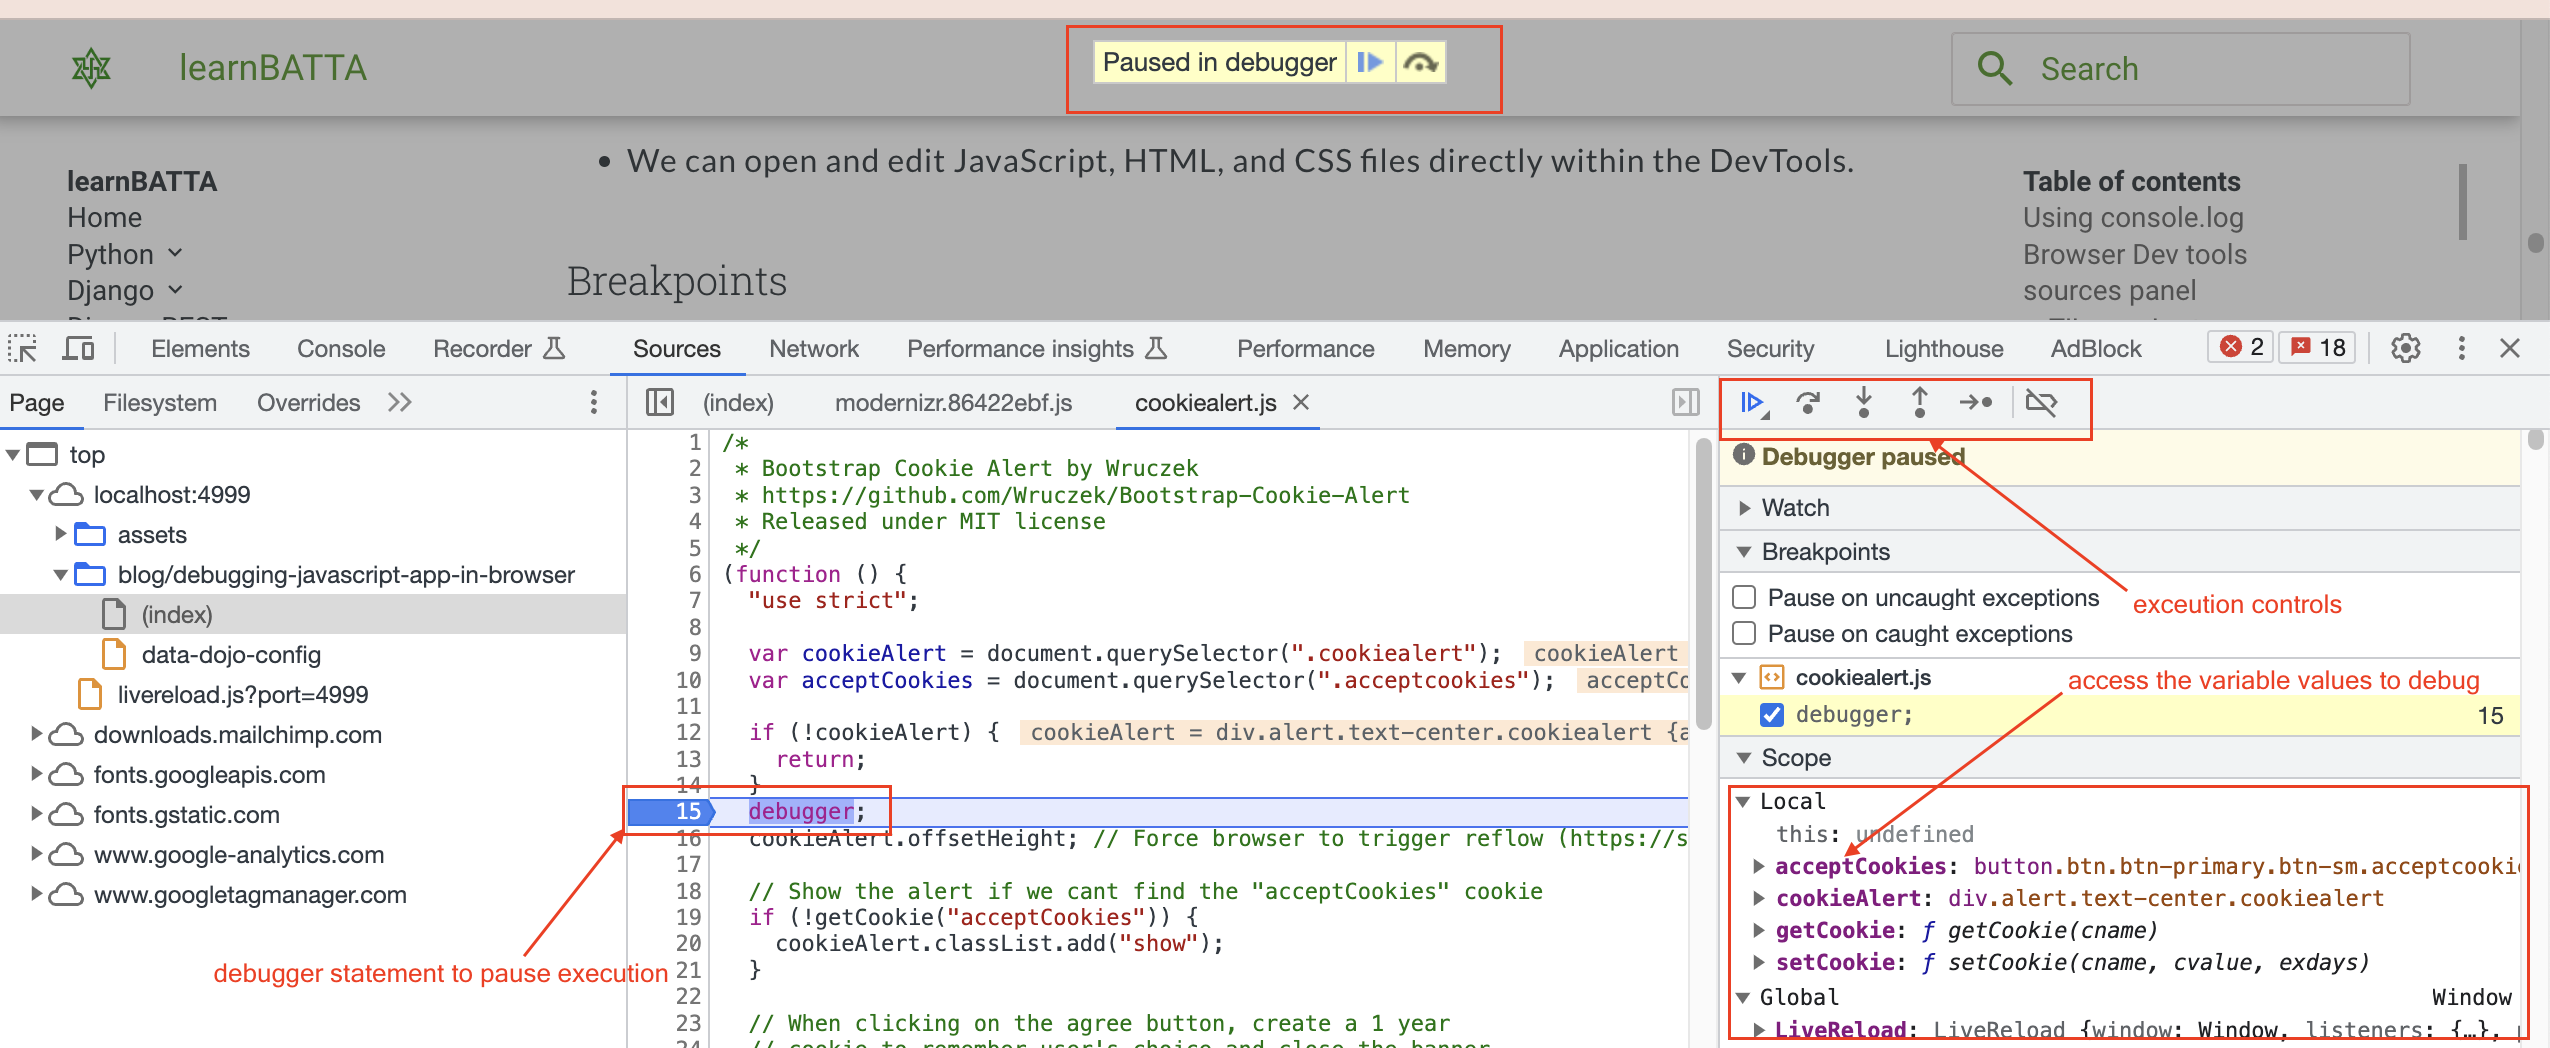
- we can also add the keyword
debugger;at the line of the code where we want to pause the exection to debug. - we access the variable values in
consoleandsourcespanels. - it helps to find the issue quickly.
- we can use debug controls to go to next line of execution, skip till a function and go to previous execution of line, etc.
Debugging Steps
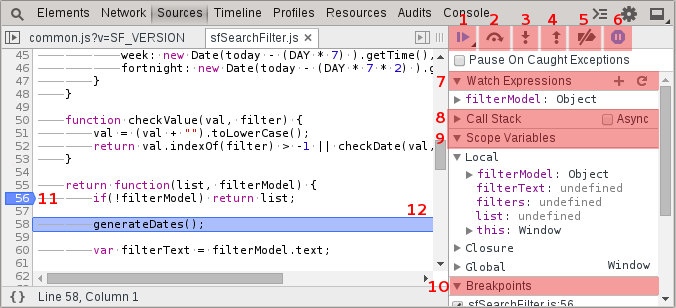
- Resume script execution - F8
- Step over to the nex function call - F10
- Step into the next function call - F11
- Step out of the current function scope - shift + F11
- Deactivate all breakpoints.
- Pause on exceptions - very useful for inspecting the context of application errors.
- Watch Expressions - expressions that will be continuously evaluated as you step through the application.
- Call stack - View and navigate to frames in the call stack. Can evaluate expressions and inspect the context of other frames.
- Scope Variables - inspect variables within the current context.
- Breakpoints - a list of all current breakpoints in the application. Enable/disable them through the checkbox.
- Click a line to add or remove a breakpoint.
- The currently executing line.